Synchronous Rails apps need a new approach to autoscaling; focusing on queue latency over CPU metrics boosts performance and user experience.
Key Insights on Rails Autoscaling
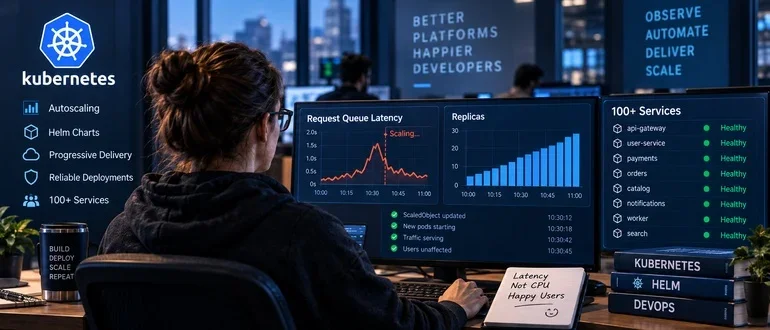
When it comes to autoscaling synchronous Rails applications, relying on CPU and memory metrics can lead to delayed performance responses. Instead, focusing on queue latency offers a more immediate signal for scaling needs during peak traffic. This approach ensures that user experience remains smooth and error-free, a necessity for any production application.
The Autoscaling Dilemma
Common knowledge dictates that CPU usage is the go-to metric for scaling web services. However, my experiences with diverse applications in Kubernetes revealed a significant flaw: CPU and memory are lagging indicators, often leading to user wait times and eventual errors before the infrastructure reacts. In a Rails environment, where high traffic can quickly saturate resources, this can spell disaster.
The Underlying Challenge
Real-world deployments often involve numerous services across different languages, making it challenging for teams to standardize autoscaling mechanisms. While deploying a single application might seem straightforward, managing 100+ services reveals inconsistencies and inefficiencies. For instance, teams frequently diverge in their configuration approaches, implementing varied scaling strategies that lead to operational chaos.
Why Latency Trumps CPU
Taking cues from my experience, the crucial distinction lies in understanding that for synchronous requests, measuring how long a request sits in the queue—queue latency—is far more relevant than CPU utilization. When traffic surges, users may be left waiting without any corresponding increase in CPU usage until it’s too late. This latency directly correlates with user satisfaction and error rates, making it a more reliable metric to guide autoscaling decisions.
Strategies for Effective Autoscaling
The approach I recommend focuses on real-time latency metrics. Here’s a streamlined process for integrating queue latency into autoscaling:
- Collect latency data: Modify your web server (like Unicorn or Puma) to report request queue times through your monitoring tool of choice, such as Datadog.
- Set external metrics: Use tools like KEDA to create a scaling signal based on queue latency—trigger scaling actions when latency breaches a defined threshold, such as 500 ms.
- Implement fallback mechanisms: Configure a minimum replica count as a backup in case your metrics provider fails to avoid total capacity lockout during high-demand periods.
By adjusting the scaling approach to focus directly on user experience, we can minimize the chances of service degradation.
Background Jobs and Queue Depth
While queue latency is crucial for synchronous web requests, different metrics apply for asynchronous background jobs, such as those handled by Sidekiq. For these types of workloads, queue depth—the number of jobs waiting to be processed—becomes the vital signal. Here, the goal is managing backlog rather than immediate user wait times, which can lead to greater efficiency and optimized resource use.
Creating Consistent Deployments
Incorporating best practices in deployment processes ensures reliability across services. We adopted Helm charts with built-in configurations that encode essential aspects of app deployment. This includes parameters such as:
- Pod Disruption Budgets (PDBs): Safeguarding against outages caused by unplanned disruptions.
- Health probes: Ensuring services only receive traffic when healthy to minimize user impact during updates.
- Progressive delivery mechanisms: Techniques like canary deployments or blue/green strategies help safely roll out changes, automatically rolling back on significant errors.
The intent is to ensure that every deployment simplifies the operational aspects, allowing developers to focus on building features rather than wrestling with infrastructure details.
Standardizing Ownership
With scale comes complexity, and to handle it effectively, we imposed a structure around service ownership. Every service deployed through our Helm charts carries metadata that automatically assigns responsibility to the corresponding team. This optimization greatly reduces confusion during incidents and ensures rapid troubleshooting without manual intervention.
Final Thoughts on Autoscaling at Scale
Effective autoscaling for synchronous applications does not hinge on traditional metrics such as CPU or memory but rather on response times that directly affect user experiences. By concentrating on queue latency for web requests and queue depth for background processes, we can enhance performance significantly. Furthermore, adopting default safety measures in deployment practices allows for robust infrastructure that scales seamlessly across various services, ultimately fostering an environment that prioritizes user experience and operational efficiency.
As organizations grow, simplifying decisions through well-defined defaults becomes paramount. Each configuration carries intention; ensuring they are sound from the outset means fewer opportunities for error and a more stable platform as demand increases.
Discussion
Sign in to join the discussion.